
We can create candlestick chart and plot the moving averages in Python and Tableau.
Creating Candlestick Chart in Python
# Import packages
import numpy as np
import pandas as pd
import matplotlib.pyplot as plt
from matplotlib import style
from matplotlib.finance import candlestick_ohlc
import matplotlib.dates as mdates
# Read data and set date as index
bitcoin = pd.read_csv("https://raw.githubusercontent.com/azmirfakkri/datascience-projects/master/Datasets/coins.csv", index_col = 'Date')
bitcoin.index = pd.to_datetime(bitcoin.index)
# Store Bitcoin open, high, low and close values
btc_ohlc = bitcoin[['BTC_open', 'BTC_high', 'BTC_low', 'BTC_close']]
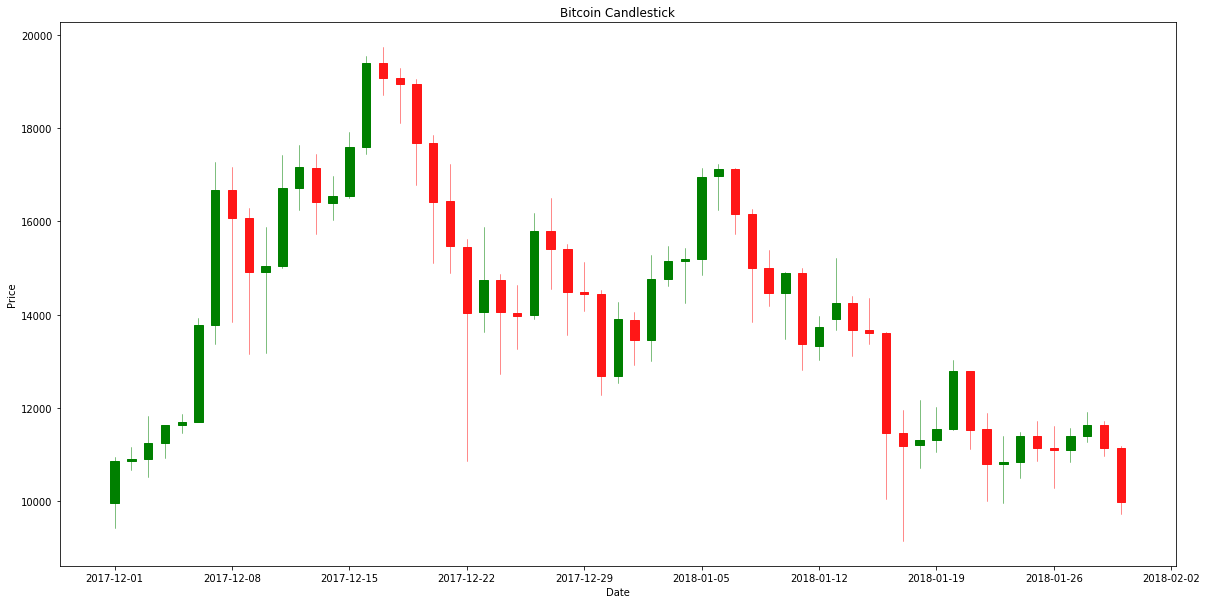
# Define a function to create candlestick for other cryptocurrencies

def cs_plot(btc_ohlc, title=''):
    btc_ohlc.reset_index(inplace=True)
    btc_ohlc["Date"] = btc_ohlc["Date"].map(mdates.date2num)

    fig = plt.figure(figsize=(20,10))
    f1 = plt.subplot2grid((1, 1), (0, 0))
    f1.xaxis_date()
    candlestick_ohlc(f1, btc_ohlc.values, width=0.5, colorup='g', colordown='#ff1717')

    plt.ylabel('Price')
    plt.xlabel('Date')
    plt.title(title)
    return
# Specify the range of dates
btc_ohlc = btc_ohlc.loc['20171201':'20180130']

# Plot using the defined function, cs_plot
cs_plot(btc_ohlc, title='Bitcoin Candlestick')
Plot Moving Average in Python
# Store bitcoin weighted price as wp_btc and set the range of date
wp_btc = bitcoin['BTC_weighted_price']
wp_btc = wp_btc['20170101':]
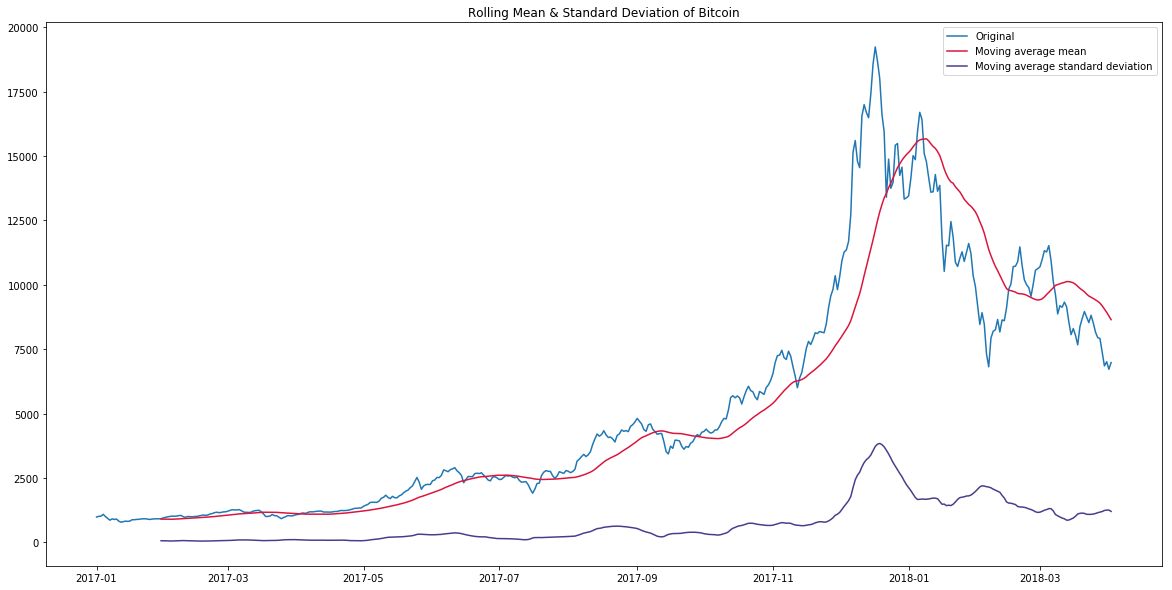
# Define function plot_rolling average for other cryptocurrencies
def plot_rolling_average(wp_btc, title='Rolling Mean & Standard Deviation of Bitcoin', window=12):
#calculate moving averages
rolling_mean = wp_btc.rolling(window=window,center=False).mean()
rolling_std = wp_btc.rolling(window=window,center=False).std()
#plot statistics
fig = plt.figure(figsize=(20,10))
plt.plot(wp_btc, label='Original')
plt.plot(rolling_mean, color='crimson', label='Moving average mean')
plt.plot(rolling_std, color='darkslateblue', label='Moving average standard deviation')
plt.legend(loc='best')
plt.title(title)
return
plot_rolling_average(wp_btc, title='Rolling Mean & Standard Deviation of Bitcoin', window=30)
Create Candlestick and Bollinger Charts in Tableau
Let’s plot the same type of charts to see the power of dashboard interactivity in Tableau.